 dbatools
Simplifying Extended Events Management with dbatools
Gianluca Sartori and I recently presented Simplifying Extended Events with dbatools at SQL Bits and we had a lot of fun. Not only that, we helped convince several people to switch! Honestly, when we proposed the session, I was totally #TeamProfiler. I figured if PowerShell didn’t convince me, I would let people know where I stood, but I was open to switching teams.
SQLBits was awesome! The people, the events, the speaker shirt, the swag, the food, the everything. If you ever get a chance to go, I highly recommend it.
So Why Do People Keep Using Traces / Profiler?
As you may know, Microsoft deprecated Profiler/traces 5 years ago in favor of Extended Events. Unlike traces, XEvents are lightweight and even offer more information about what’s going on within the engine.
How badly do traces impact performance? Jonathan Kehayias gives details in his article Measuring “Observer Overhead” of SQL Trace vs. Extended Events.
So why do people keep using traces? We compiled a list of reasons from Erin Stellato’s Why do YOU avoid Extended Events. And this list is LONG!
Traces are straightforward and less complex than Extended Events Totally seems that way!
Traces provide a consistent interface for mixed environments Whether you use SQL Server 7 or SQL Server 2017, the interface is pretty much the same.
Traces are faster to setup quick traces Just open up Profiler, connect to a server, click a few times and you’re set.
“Extended Events are more efficient for the SQL Server engine, but not more efficient for the DBA” Love this quote.
People already have a library of Profiler templates Including me
Ignorance of XML / Querying all the generated XML is outrageous When I first saw what it takes to query Extended Events, I bailed immediately. I am not learning XPATH, ever.
Templates work remotely across all instances This is also true for Extended Events, but the commenter did not know that.
XEvents are persistent and must be stopped manually Once you close Profiler or restart SQL Server, all non-default traces will disappear. Extended Events will persist until you delete them.
Ability to import PerfMon data and look at Trace and PerfMon counter data at the same time Most people that use Profiler don’t seem to know about this feature but those who do LOVE it. You can read more at Brad McGehee’s Correlating SQL Server Profiler with Performance Monitor.
Microsoft reportedly has no plans to provide this functionality.
Consistent user experience across SSAS and Database Engine Gotta take their word, I don’t use SSAS.
It’s easy to train others to use Profiler Imagine - if it’s easier to learn Profiler, it’ll be far easier to teach.
Traces can be easily replayed There are a number of Microsoft tools to replay traces, but none to replay Extended Events.
MS Premier Support still asks for traces Likely because they also have tools that they want to work across all supported versions, which still includes SQL Server 2008 R2.
xe_file_target_read_file is a CPU hog This wasn’t listed on Erin’s page but was told to me while I was performing my research.
Whewf! That’s a lot of compelling reasons not to make the switch. So let’s see how we can address each of them using PowerShell. All code listed here can be found at sqlps.io/xecode.
PowerShell/dbatools Can Help
First, I’ll start with the bad news. There were a few things we couldn’t address.
# Complaint: Consistent interface for mixed environments
# Answer: CLOSED, WON'T FIX
# Complaint: MS Premier Support still asks for traces
# Answer: CLOSED, WON'T FIX
# Complaint: Consistent user experience across SSAS and Database Engine
# Answer: Need more information
But now for those we could!
Existing Library of Profiler Templates
No problem! We took Jonathan Kehayias’s awesome sp_SQLskills_ConvertTraceToExtendedEvents script, wrapped it in PowerShell and made it easy to convert all of your traces on all of your servers to Extended Events.
# Complaint: Already have a library of Profiler templates
# Answer: Convert them instantly to Sessions (h/t Jonathan Kehayias)
Get-DbaTrace -SqlInstance localhost\sql2017 -Id 1 | ConvertTo-DbaXESession -Name 'Default Trace' | Start-DbaXESession

# Go look in SSMS! :D

# Stop or remove those bad boys
Get-DbaTrace -SqlInstance localhost\sql2017 -Id 2 | Stop-DbaTrace
Get-DbaTrace -SqlInstance localhost, localhost\sql2016, localhost\sql2017 | Out-GridView -PassThru | Remove-DbaTrace
It’s Faster to Setup Quick Traces
To setup a trace in Profiler, you connect to a single server, click, click, click and you’re set.
Now, it’s even easier to setup a “quick session” in Extended Events. Just select an included template from dbatools and import!
# Complaint: Faster to setup quick traces
# Complaint: Templates work remotely across all instances
# Answer: Now you can easily deploy all of your session templates SUCH AS LONG RUNNING QUERIES
$servers = "localhost\sql2016","localhost\sql2017"
Get-DbaXESessionTemplate | Out-GridView -PassThru | Import-DbaXESessionTemplate -SqlInstance $servers

<#
      No suitable template? Use SSMS to create New Sessions
#>

# now redeploy existing sessions across your whole enterprise
Get-DbaXESession -SqlInstance localhost\sql2017 -Session 'Acme Sample' | Export-DbaXESessionTemplate | Import-DbaXESessionTemplate -SqlInstance localhost\sql2016

Start-Process "$home\Documents\SQL Server Management Studio\Templates\XEventTemplates"
Note that while we do enable the ability to easily export/import your own newly created XEvent, we currently don’t have a nice and easy way to create XEvents. If you’d like to contribute your own template, please do feel free!
Unlike Traces, Extended Event Sessions Persist
It’s true, they do! And this annoyed me at first too, but now I appreciate it. One reason is that XEvents are so hard to manage. You gotta go server by server, click Management -> Extended Events -> Sessions.
It took time for me to come around, though. And I want to give you that time too. So here’s our solution.
# Complaint: XEvents are persistent
# Answer: Actually a good thing, especially if they are managable. But, you can discover that for yourself. Until then...
"localhost", $servers | Get-DbaXESession | Out-GridView -PassThru | Remove-DbaXESession

# But that's not all!
Get-Command -Module dbatools -Name *DbaXe* | Out-GridView
Ultimately, when it’s hard to manage Extended Events, you don’t want many of them around. But look at how easy it is to get a listing of my lab’s XEvent Sessions. You can pipe any of these to remove, stop, start or export them.

Remembering to Stop a Session
Within Profiler, it’s easy to set a time to stop a trace. But traces don’t support this functionality out of the box - Profiler does. If you need to stop a session after a set amount of time, we can help!
# Complaint: Remembering to turn off Xevent
# Answer: PowerShell can help in 3 ways

# Answer: Auto create a disappearing Agent job
Start-DbaXESession -SqlInstance localhost\sql2017 -Session 'Long Running Queries' -StopAt (Get-Date).AddMinutes(30)

# Answer: Use dbachecks
Set-DbcConfig -Name policy.xevent.requiredstoppedsession -Value 'Long Running Queries'

# Imagine a scheduled run
Invoke-DbcCheck -SqlInstance localhost\sql2017 -Check XESessionStopped

# Sessions can be easily stopped (or started) en masse
$servers | Get-DbaXESession | Out-GridView -PassThru | Stop-DbaXESession
Extended Events Requires Knowledge of XML and XPATH to Query
I know - I was horrified when I saw a sample XEvent Query. But now with SQL Server Management Studio 17.x and dbatools, it’s way easier to see and filter the results of XEvents.
The limitation with SSMS is that you work with just one server at a time. The benefit is that it’s quick, easy and filterable.

The good thing about dbatools is that you can get the same benefits with more than one server. This is especially good for total instance aggregation. And like plain-ol T-SQL, PowerShell is human readable.
# Complaint: Don't know XML and XPATH, which are required to query the results
# Answer: Now you can easily use PowerShell syntax - also works with Watch-DbaXESession

# This will read ALL FILES from ALL SESSIONS if they exist
Get-DbaXESession -SqlInstance localhost\sql2017 | Read-DbaXEFile |
Where-Object client_app_name -eq 'dbatools PowerShell module - dbatools.io' | Out-GridView
And here’s the human-readable output

Extended Events Are a Lot of Work
PowerShell enables laziness, or as I prefer calling it, “efficiency” But heck, PowerShell MVP Francois-Xavier Cat even calls himself lazywinadmin. So if you’re lazy, we’ve got you.
# Complaint: I'm lazy and XEs are a lot of work
# Answer: Can't get any lazier than using PowerShell
Get-ChildItem C:\corpxetemplates | Import-DbaXESessionTemplate -SqlInstance $servers
Can’t Replay Extended Events
Profiler offers a number of ways to replay data. We offer two solutions, including a preview version of Gianluca’s XESmartTarget Replay.
Update (2025): The XESmartTarget commands (New-DbaXESmartReplay, Start-DbaXESmartTarget, New-DbaXESmartEmail) mentioned in this section were removed from dbatools in August 2025 due to dependency maintenance challenges. The Invoke-DbaXEReplay command shown below remains available. For advanced Extended Events streaming and response capabilities, consider using XESmartTarget directly.
# Complaint: Can't replay events from Session
# Answer: You can now read and execute from a xel file
Get-ChildItem small-sample.xel | Read-DbaXEFile | Invoke-DbaXEReplay -SqlInstance localhost\sql2017
Email Notification Bonus (Legacy)
The XESmartTarget integration within dbatools previously offered email notifications when events occurred. While these commands have been removed from dbatools, you can still use the standalone XESmartTarget tool for this functionality.
Profiler Offers the Ability to Compare PerfMon and Trace
So Microsoft does not offer this ability and according to Erin Stellato’s session at Bits, they don’t plan to. When attempting to provide a solution for this, I immediately thought of putting it in Power BI and making it beautiful. Because Profiler’s version ain’t pretty
So then my question was: how can we make XEvents accessible to Power BI?
- Xevents to CSV or SQL Table
- Perfmon to CSV or SQL Table
- Mash them together
Here’s what we came up with:
Update (2025): The Export-DbaXECsv command mentioned below was removed from dbatools in August 2025. You can export Extended Events data using Read-DbaXEFile and standard PowerShell export cmdlets like Export-Csv, or write directly to a database table using Write-DbaDbTableData.
# Perfmon commands still work great!
Get-DbaPfDataCollectorSetTemplate | Out-GridView -PassThru | Import-DbaPfDataCollectorSetTemplate | Start-DbaPfDataCollectorSet

# Export perfmon to CSV for Power BI
Get-DbaPfDataCollectorSet -CollectorSet 'PAL - SQL Server 2014 and Up' | Invoke-DbaPfRelog | Select -Expand FullName | Invoke-Item

# Export Extended Events to database for analysis
Get-DbaXESession -SqlInstance localhost\sql2017 -Session 'Queries and Resources' | Read-DbaXEFile |
Write-DbaDbTableData -SqlInstance localhost\sql2016 -Table tempdb.dbo.queriesandresources -AutoCreateTable
And from the Perfmon, we created a universal dashboard:
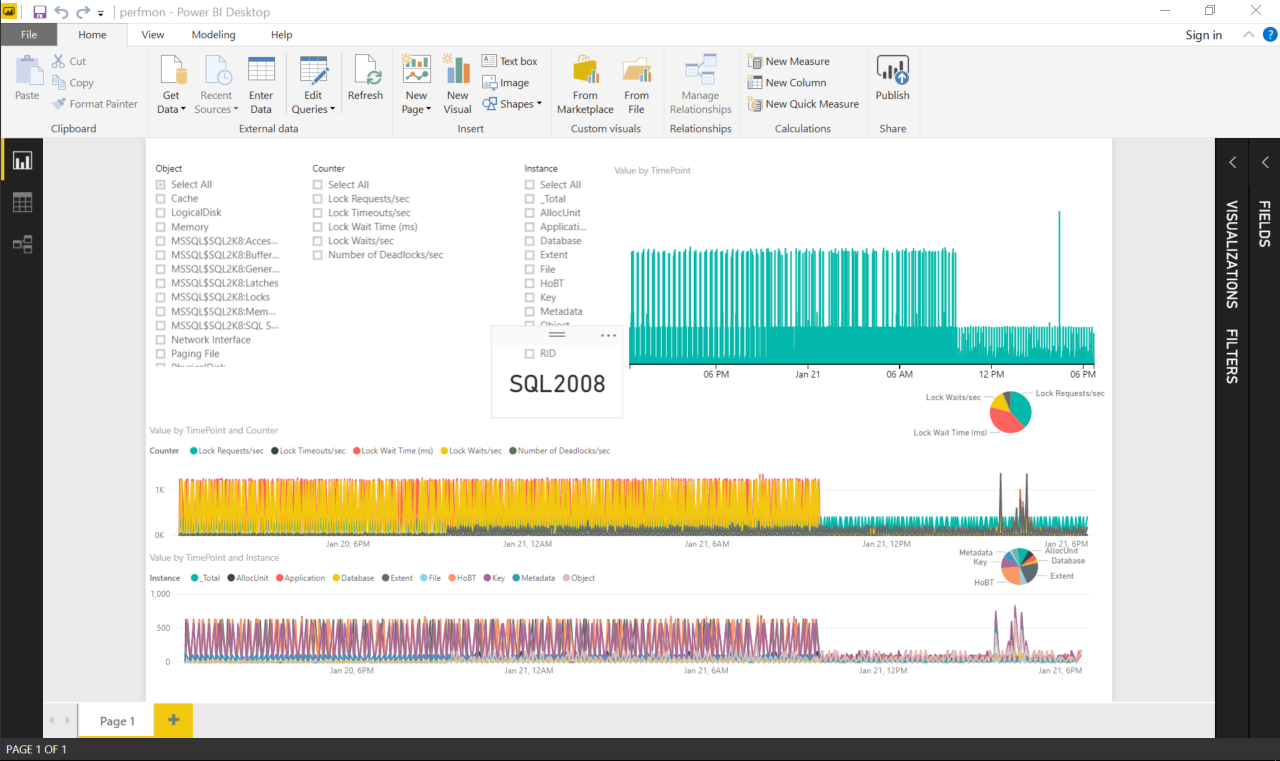
But! It still needs some work. At SQLBits, we asked for Power BI pros to help us with performance and mashing this data and the eternally awesome Johan Ludvig Brattås volunteered I cannot wait to see what Johan comes up with with the Power BI dashboard.
Also, I’m planning to write more in-depth about the Performance Monitor commands so expect more about that soon.
Reading Using xe_file_target_read_file Taxes the SQL Server CPU
Now you can offload that resource usage to your local workstation. Behind the scenes, we use Microsoft’s streaming API, similar to the one, I assume, used in SSMS.
# Complaint: Reading using xe_file_target_read_file taxes the SQL Server CPU
# Answer: Now you can read files from any workstation or server
Get-ChildItem small-sample.xel | Read-DbaXEFile
Get-DbaXESession -SqlInstance localhost\sql2017 -Session 'Deadlock Graphs' | Read-DbaXEFile

# Or, again, you can read locally and export to remote table
Get-DbaXESession -SqlInstance localhost\sql2017 -Session 'Deadlock Graphs' | Read-DbaXEFile |
Write-DbaDbTableData -SqlInstance localhost\sql2016 -Table tempdb.dbo.profiler -AutoCreateTable
In Conclusion
Hope this article has convinced you to switch from #TeamProfiler! PowerShell sure convinced me
- Chrissy